How to display AWS billing metrics in Grafana Cloud
Configuration of Grafana Cloud to display AWS billing metrics
Why Grafana for AWS billing metrics?
Grafana is well known for observability dashboards, which can be composed of many data sources.
With AWS CloudWatch metrics, it is possible to do more or less the same, but it is designed more for one account and more for the AWS metrics.
In Grafana, it's easy to use different data sources so that you can have your billing metrics on the same dashboard as your other technical and business metrics from elsewhere.
Configuration of the Grafana Cloud instance
Here https://grafana.com/products/cloud/ you can sign up for a Grafana Cloud account.
It's free for this use case (and many more :))
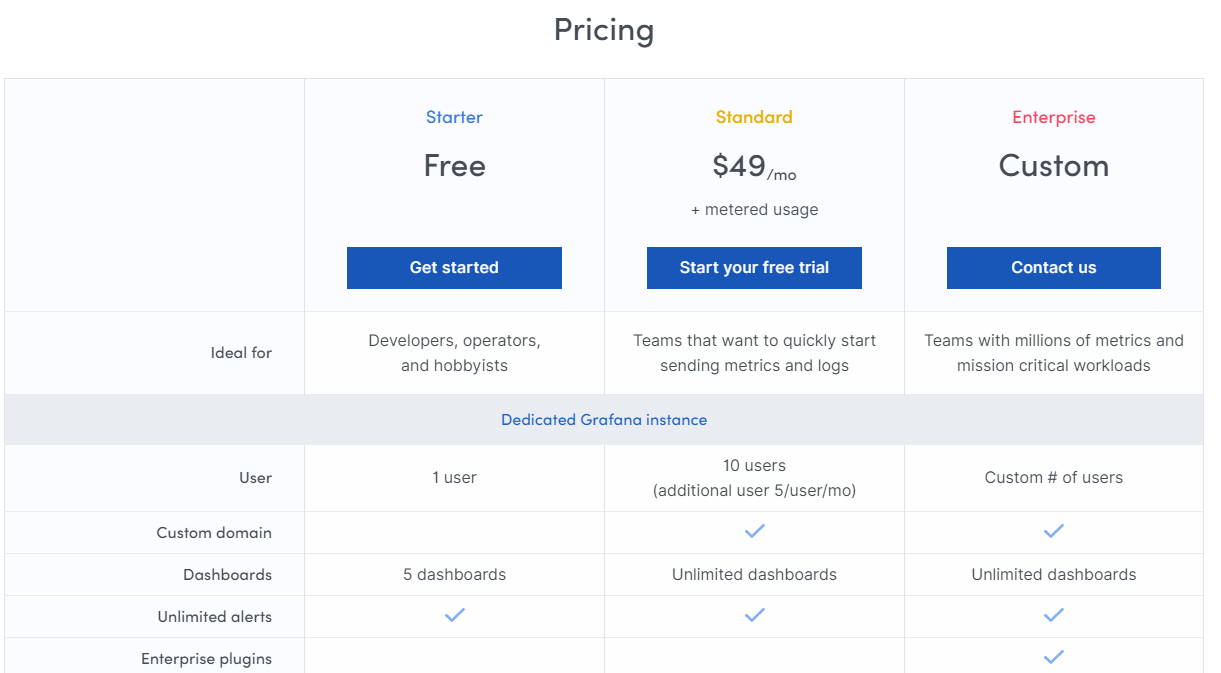
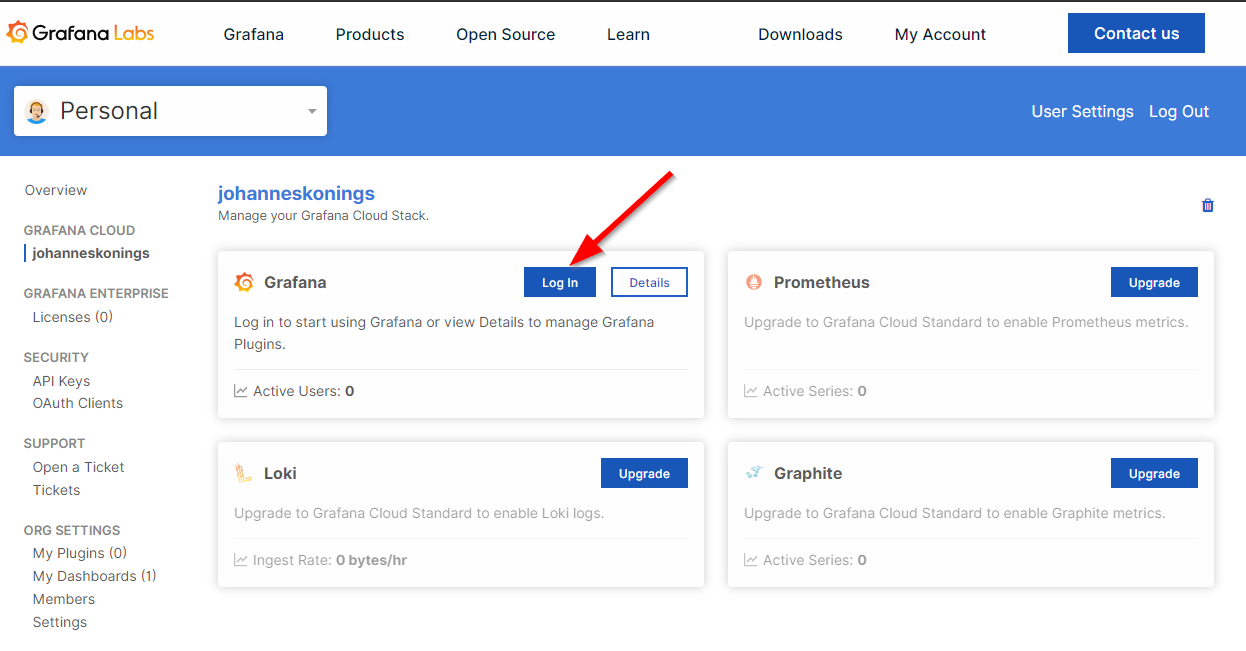
After login, create a stack with the starter plan.
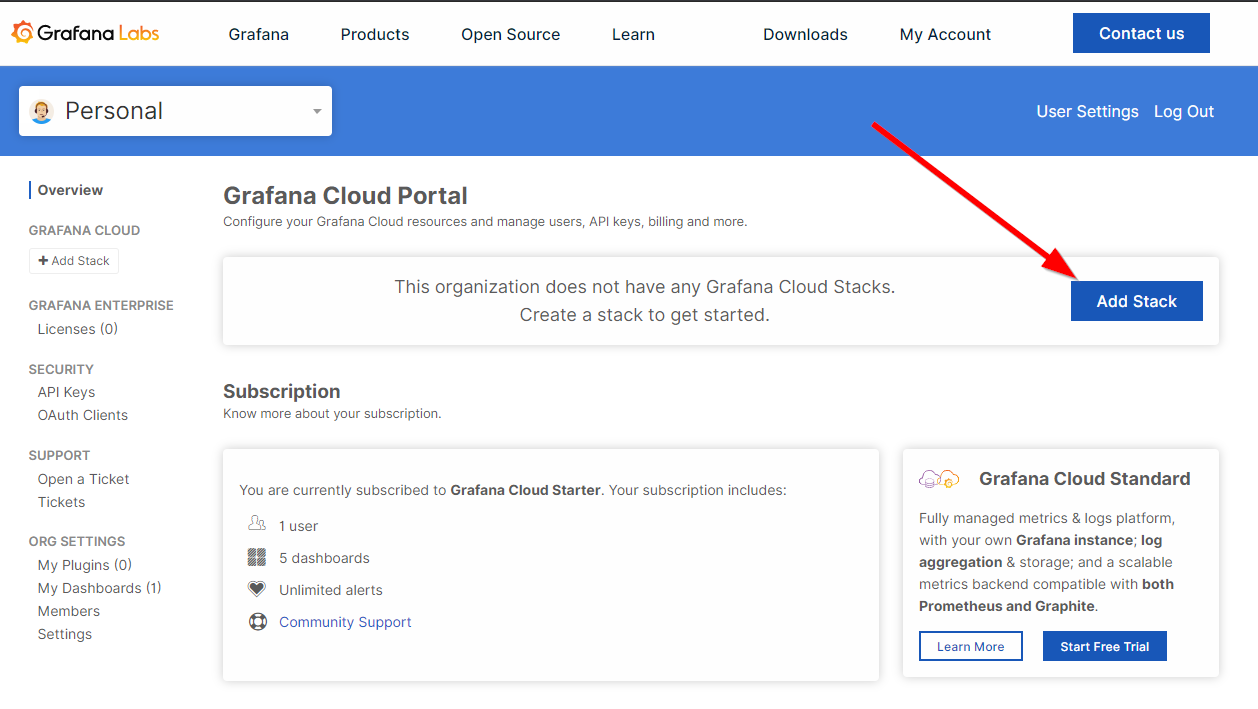
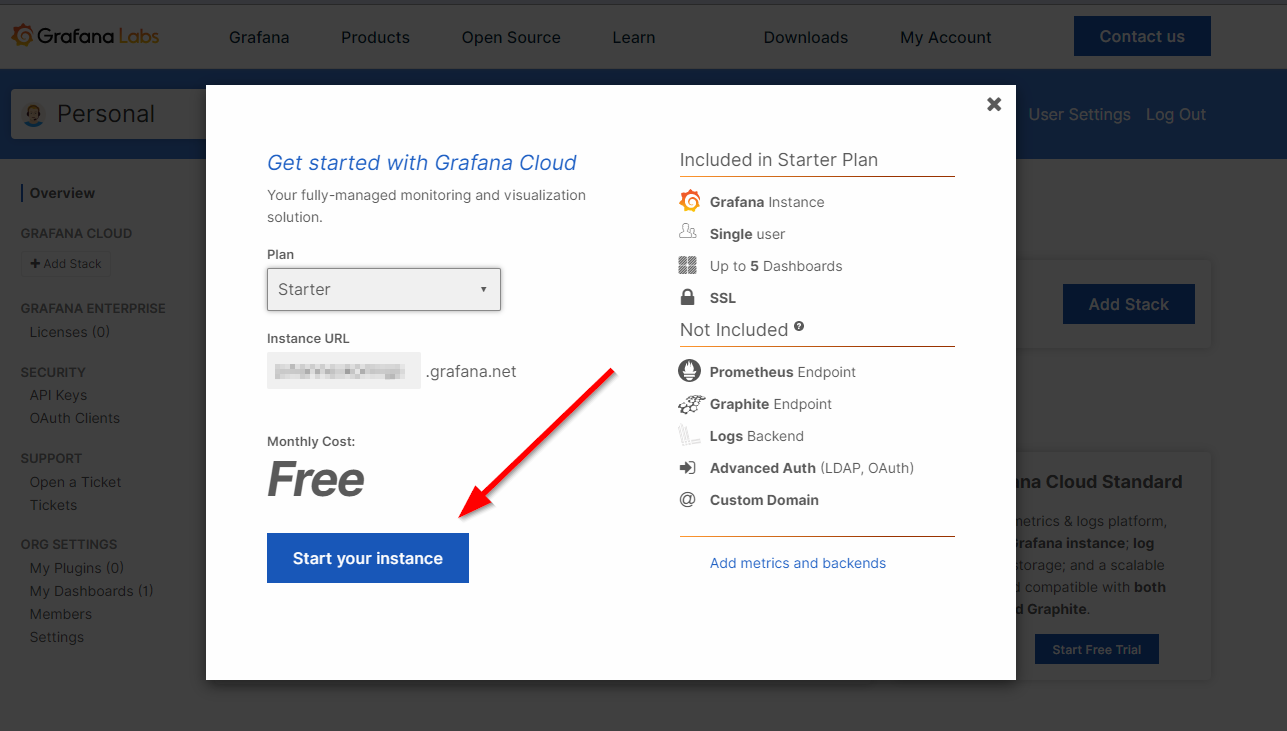
Then log in to your instance.
Creation of an IAM user for the CloudWatch data source
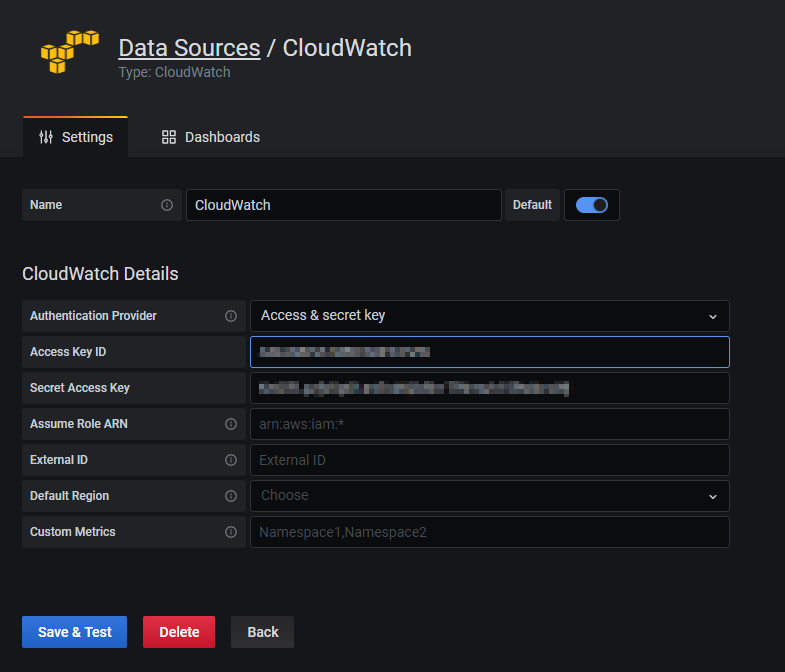
The CloudWatch data source needs an access key and a secret key. Therefore is an IAM user needed. As policy can be this used:
https://grafana.com/docs/grafana/latest/datasources/cloudwatch/#iam-policies
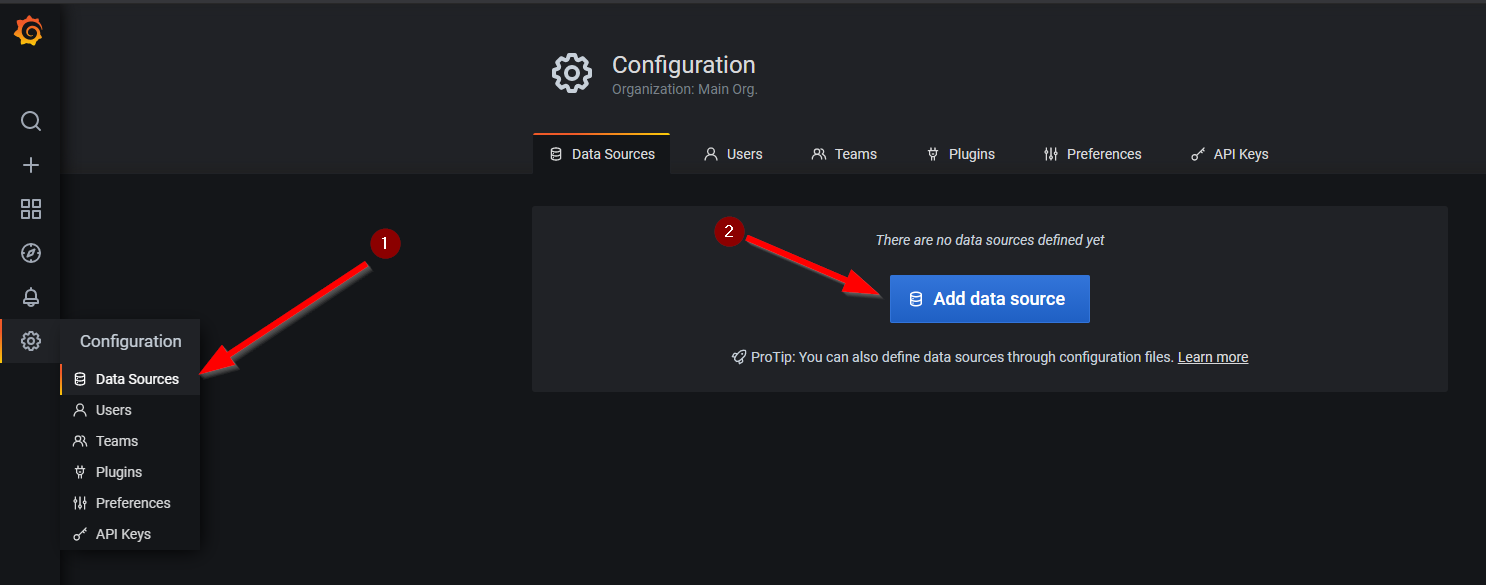
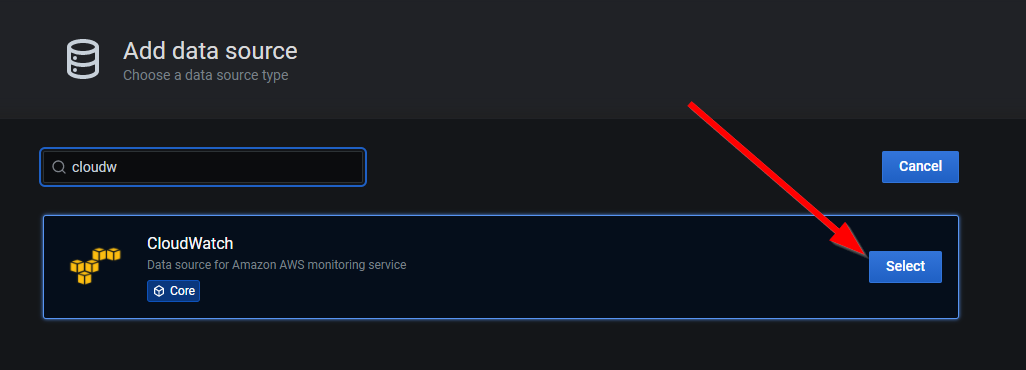
Configuration of the CloudWatch Datasource
The next step is to add the CloudWatch data source to your Grafana cloud instance.
As for credentials, use the access key and secret key from the IAM user.
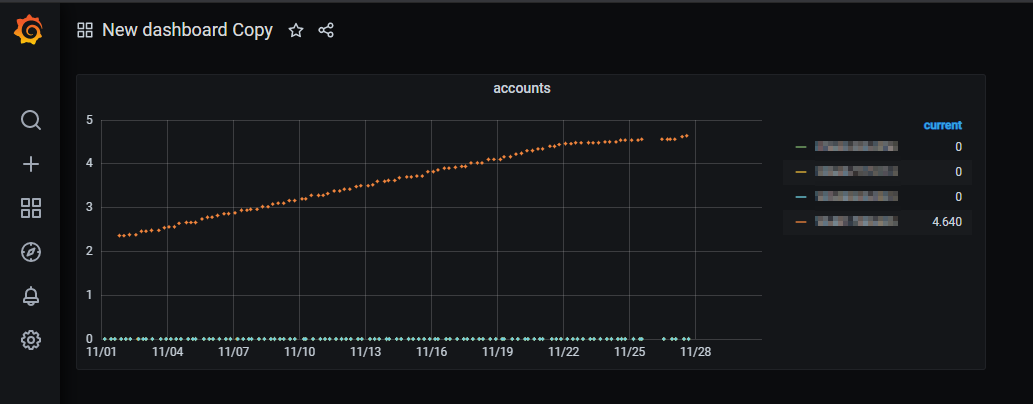
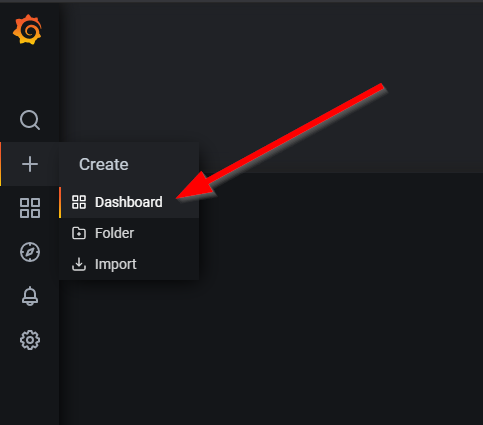
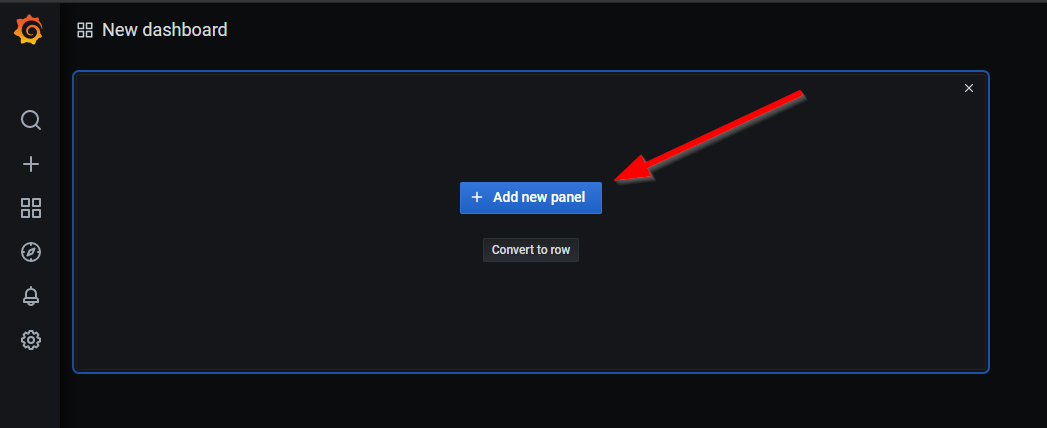
Creation of a dashboard with a graph panel
Now you can use the data source in the panels of a dashboard.
This is a panel configuration example for the costs of all linked accounts.
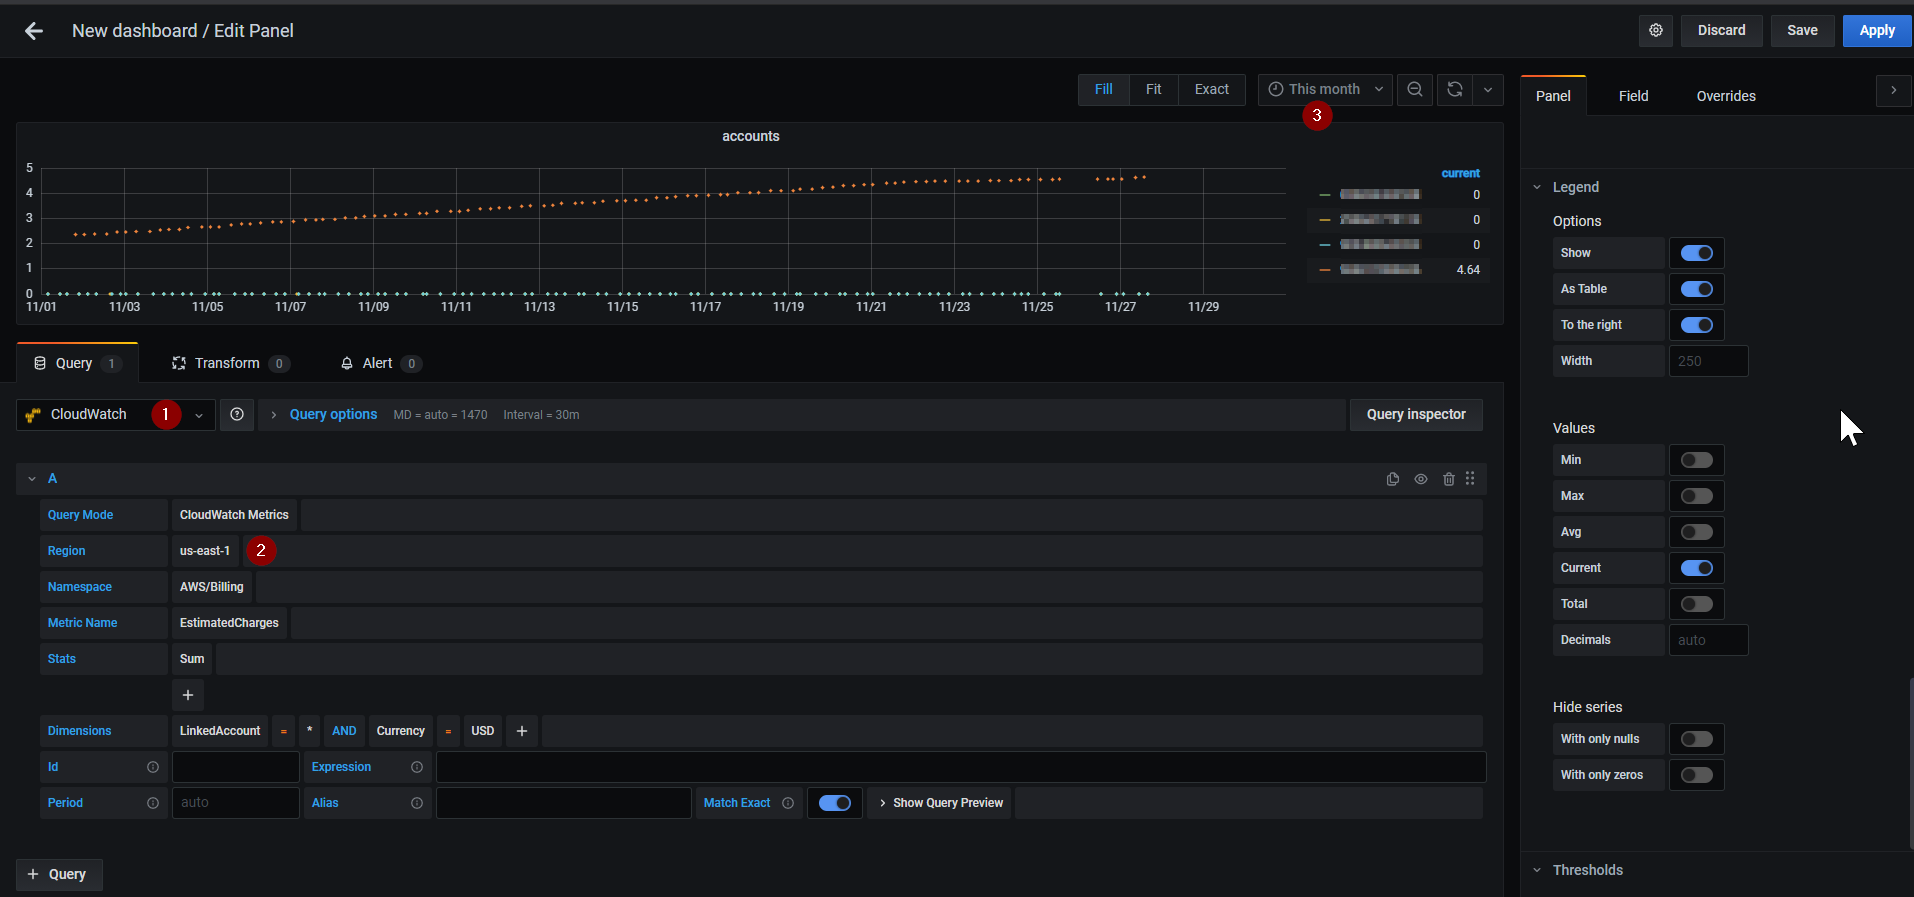
This should be considered:
- If the CloudWatch data source is not the default one, switch to the CloudWatch data source.
- Billing metrics are all in the region us-east-1
- The time frame "this month" seems the right choice for the monthly costs :)
And ready to go 🎉
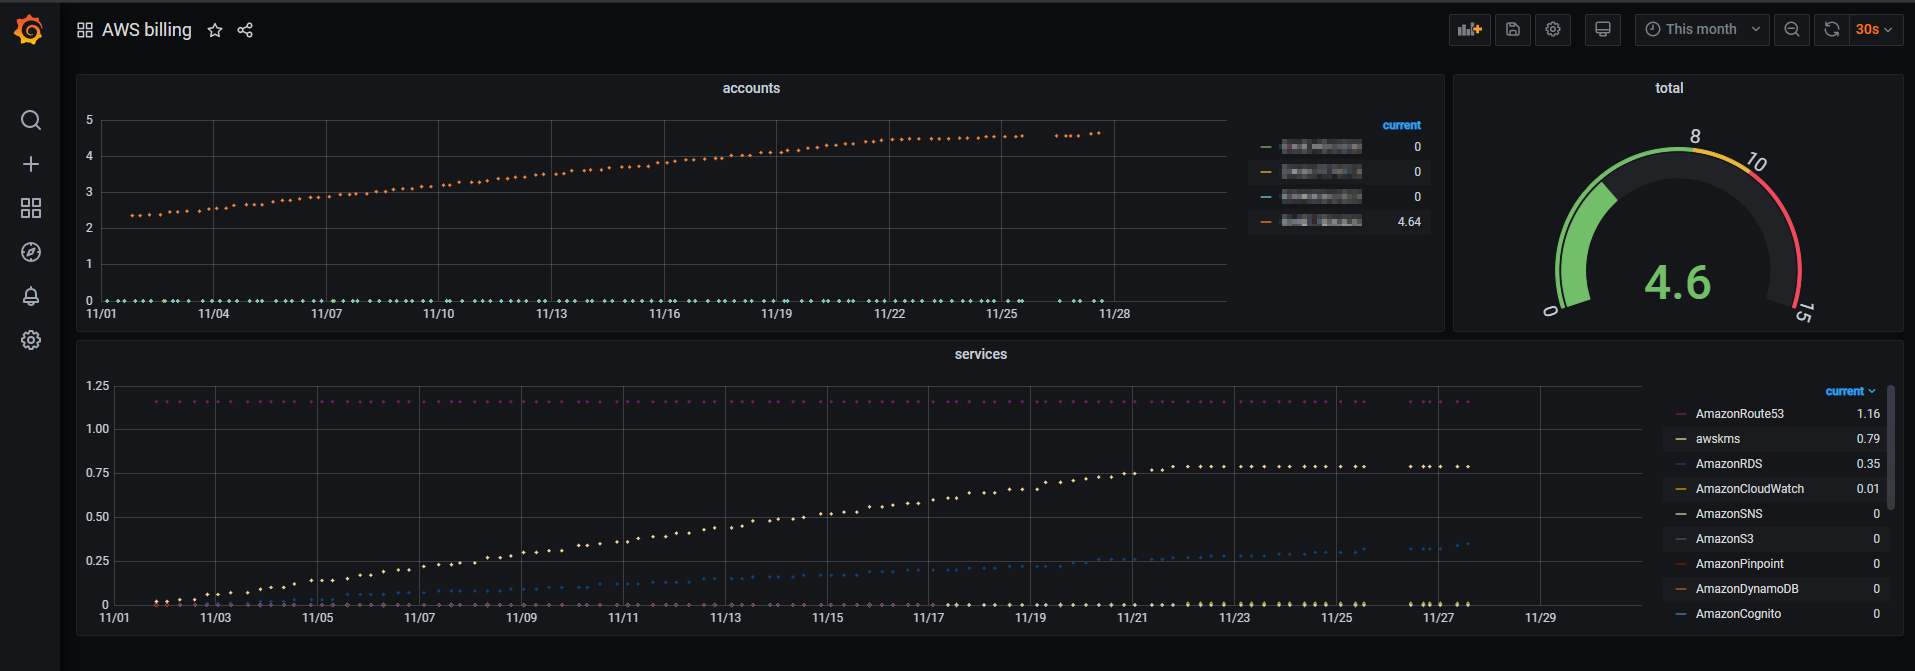
Usage of a prepared dashboard
Here https://grafana.com/grafana/dashboards is a big list of official and community dashboards you can import to Grafana.
You can import a URL or ID from the list or, e.g., this https://grafana.com/grafana/dashboards/13446 Dashboard in that way.
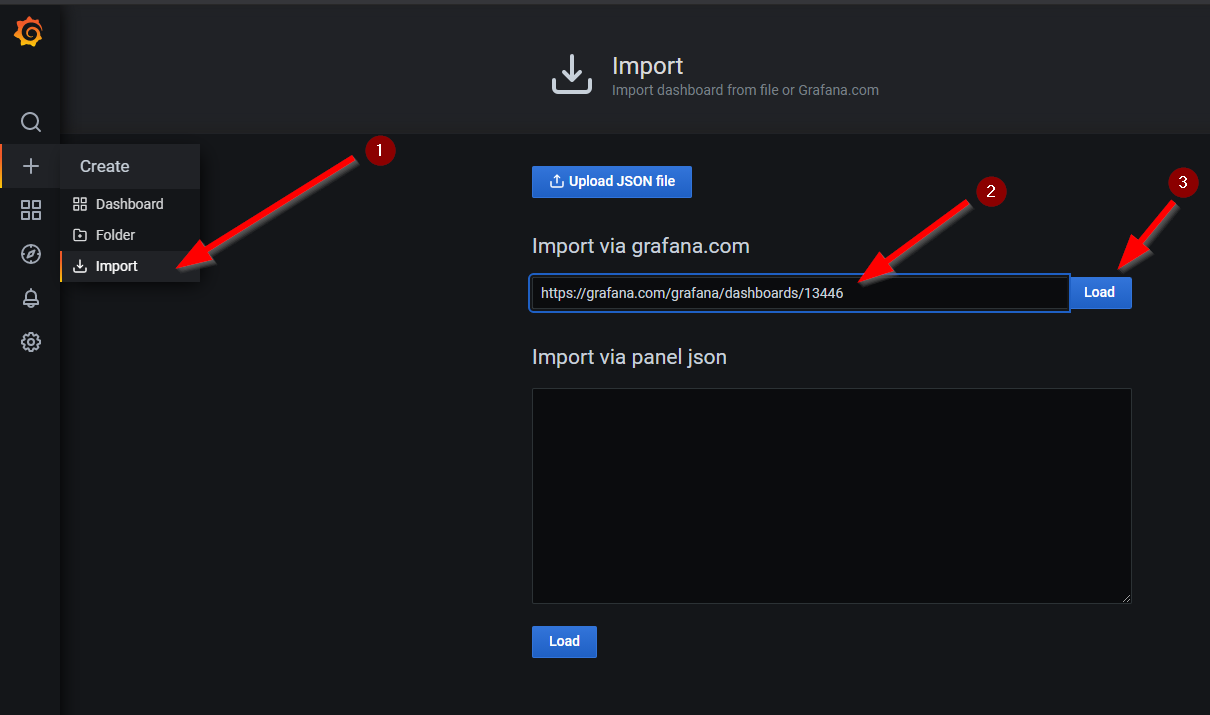
The selection of the data source is required.
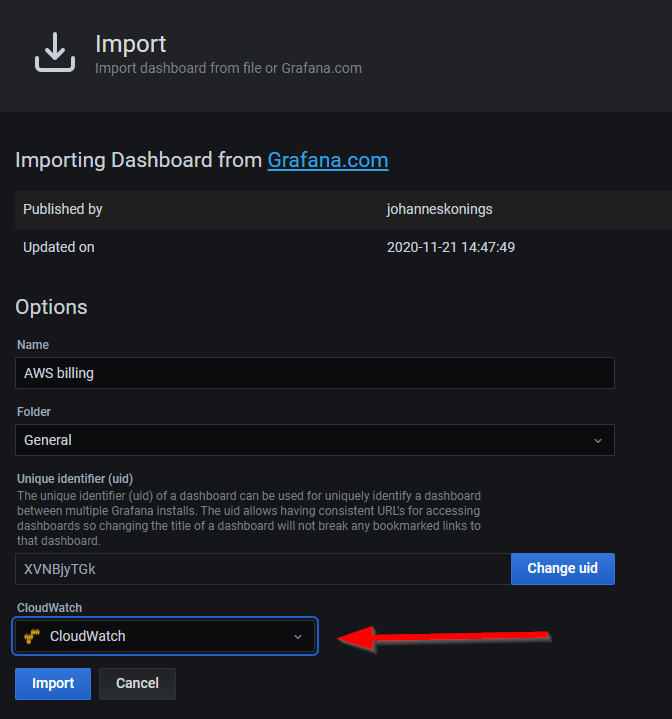
And ready to go 🎉
more dashboards
Monitoring Artist has many more cloud watch dashboards: https://grafana.com/orgs/monitoringartist