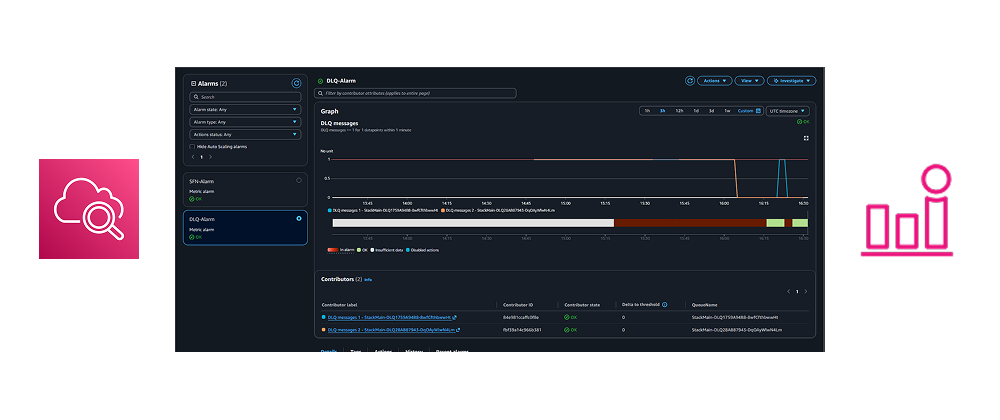
Monitor multiple resources using a single CloudWatch Alarm (with CDK)
Use CloudWatch Metrics Insights query alarms (with tags) to monitor many resources with one alarm in AWS CDK.
Introduction
CloudWatch Metrics Insights query alarms (aka “multi-metric alarms”) let one alarm evaluate many individual resources.
You write a Metrics Insights SQL query (with GROUP BY), and CloudWatch keeps the alarm’s contributor set up to date as resources are created/deleted.
Before this announcement, you had two imperfect choices:
- Create one alarm per resource (granular, but high maintenance as resources change).
- Use aggregated metrics (low maintenance, but you lose per-resource visibility and actions).
The September 2025 feature (https://aws.amazon.com/about-aws/whats-new/2025/09/amazon-cloudwatch-alarm-multiple-metrics/) adds query alarms that evaluate many individual metrics with one alarm, preserving per-resource visibility and actions while removing the per-resource alarm sprawl.
Pubudu Jayawardana already described how to use it here https://pubudu.dev/posts/cloudwatch-multi-metric-alarms/, this post focuses on how to implement the pattern in AWS CDK with concise, working examples (SQS DLQs with tag-based queries, and SFN across all state machines).
Account Configuration
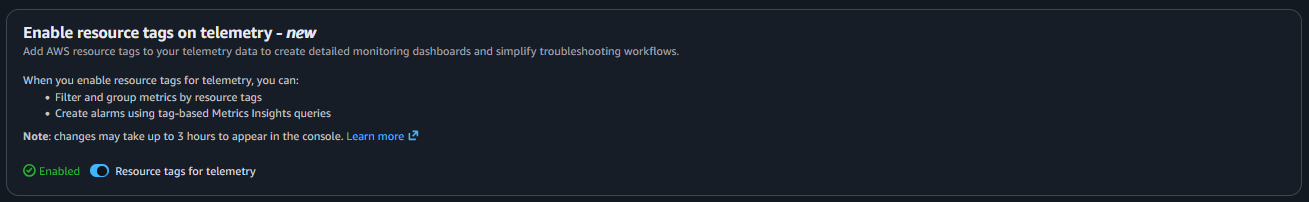
If you want WHERE tag.X = 'Y' filters in Metrics Insights queries, enable resource tags on telemetry:
https://docs.aws.amazon.com/AmazonCloudWatch/latest/monitoring/EnableResourceTagsOnTelemetry.html
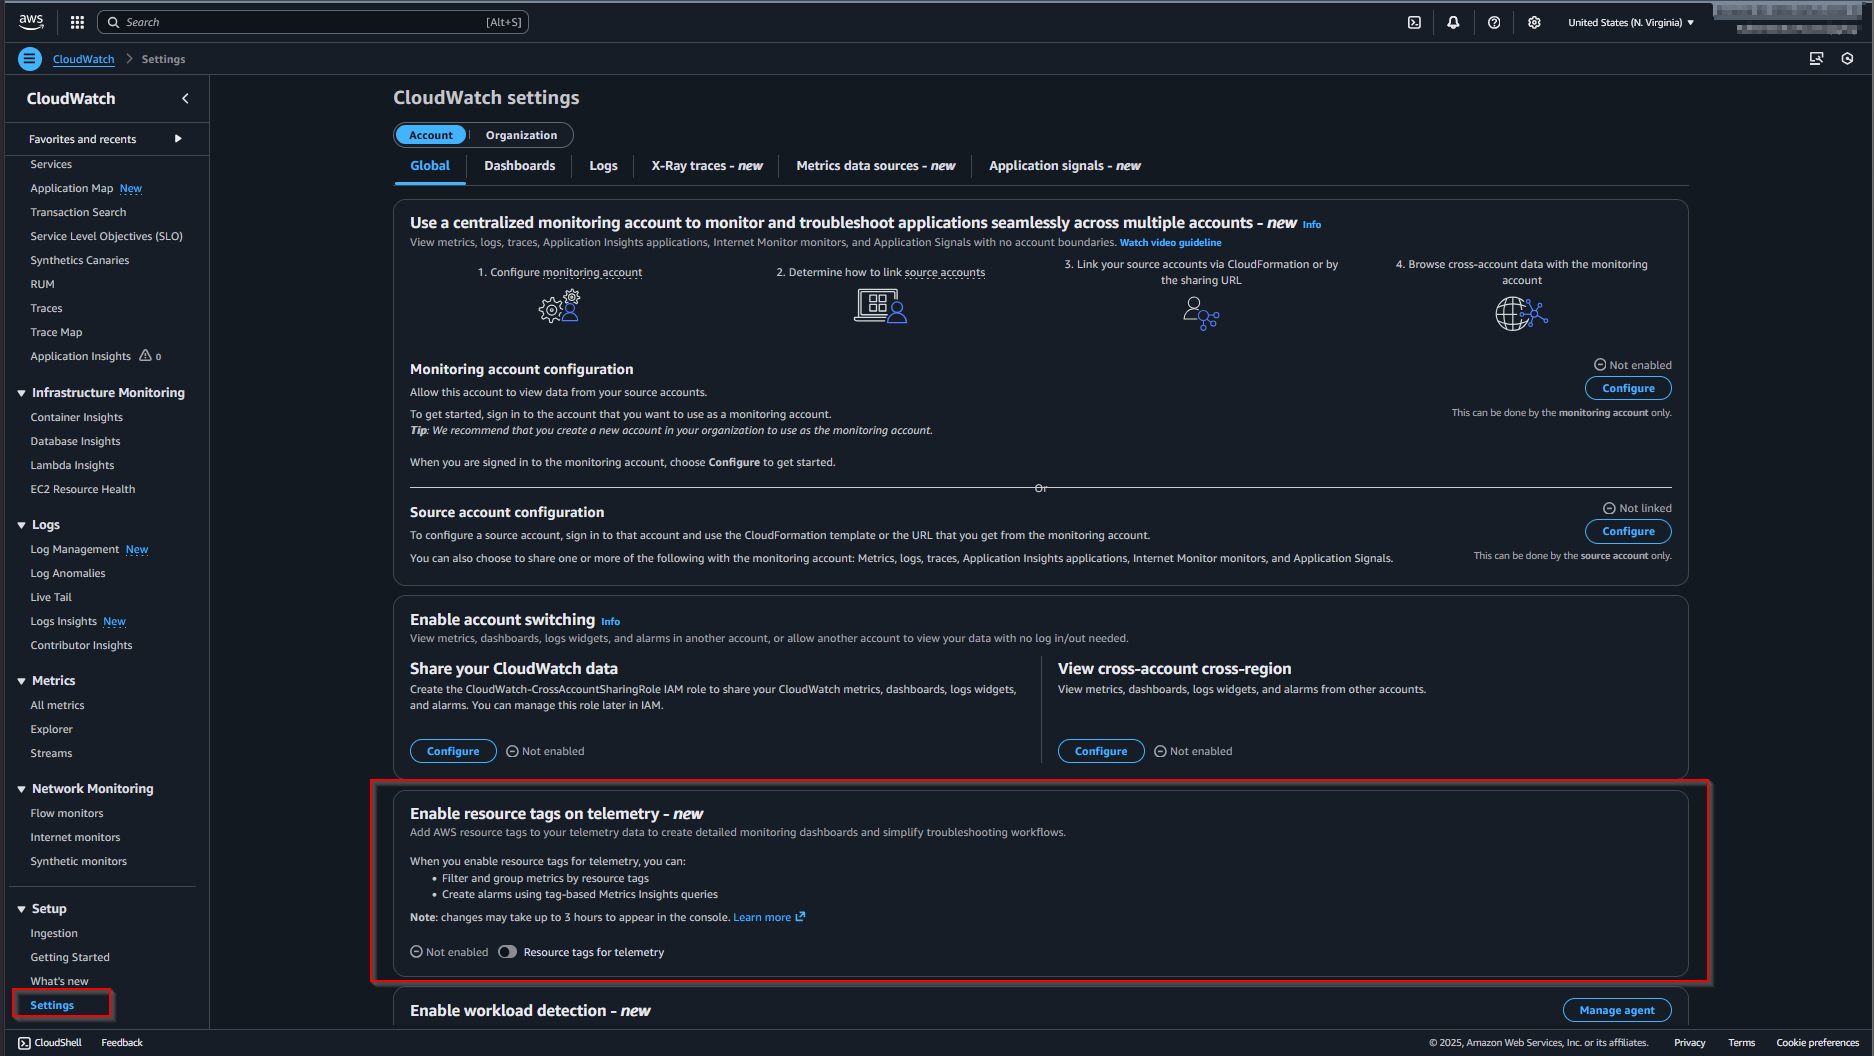
As of 2025-12, this setting isn’t exposed as a CloudFormation resource. CloudWatch may take up to a few hours to fully enrich all metrics after enabling.
CLI equivalent:
aws observabilityadmin start-telemetry-enrichmentIf you want this in CDK, use a Lambda-backed custom resource that calls the same API:
// https://docs.aws.amazon.com/AWSJavaScriptSDK/v3/latest/client/observabilityadmin/command/StartTelemetryEnrichmentCommand/
// https://docs.aws.amazon.com/AmazonCloudWatch/latest/monitoring/EnableResourceTagsOnTelemetry.html
new AwsCustomResource(this, "StartTelemetryEnrichment", {
  onCreate: {
    service: "@aws-sdk/client-observabilityadmin",
    action: "StartTelemetryEnrichment",
    physicalResourceId: PhysicalResourceId.of("StartTelemetryEnrichment"),
  },
  installLatestAwsSdk: true,
  // policy: AwsCustomResourcePolicy.fromSdkCalls({ resources: AwsCustomResourcePolicy.ANY_RESOURCE }),
  policy: AwsCustomResourcePolicy.fromStatements([
    new PolicyStatement({
      effect: Effect.ALLOW,
      actions: [
        "observabilityadmin:StartTelemetryEnrichment",
        "iam:CreateServiceLinkedRole",
        "resource-explorer-2:CreateIndex",
        "resource-explorer-2:CreateManagedView",
        "resource-explorer-2:CreateStreamingAccessForService",
      ],
      resources: ["*"],
    }),
  ]),
});
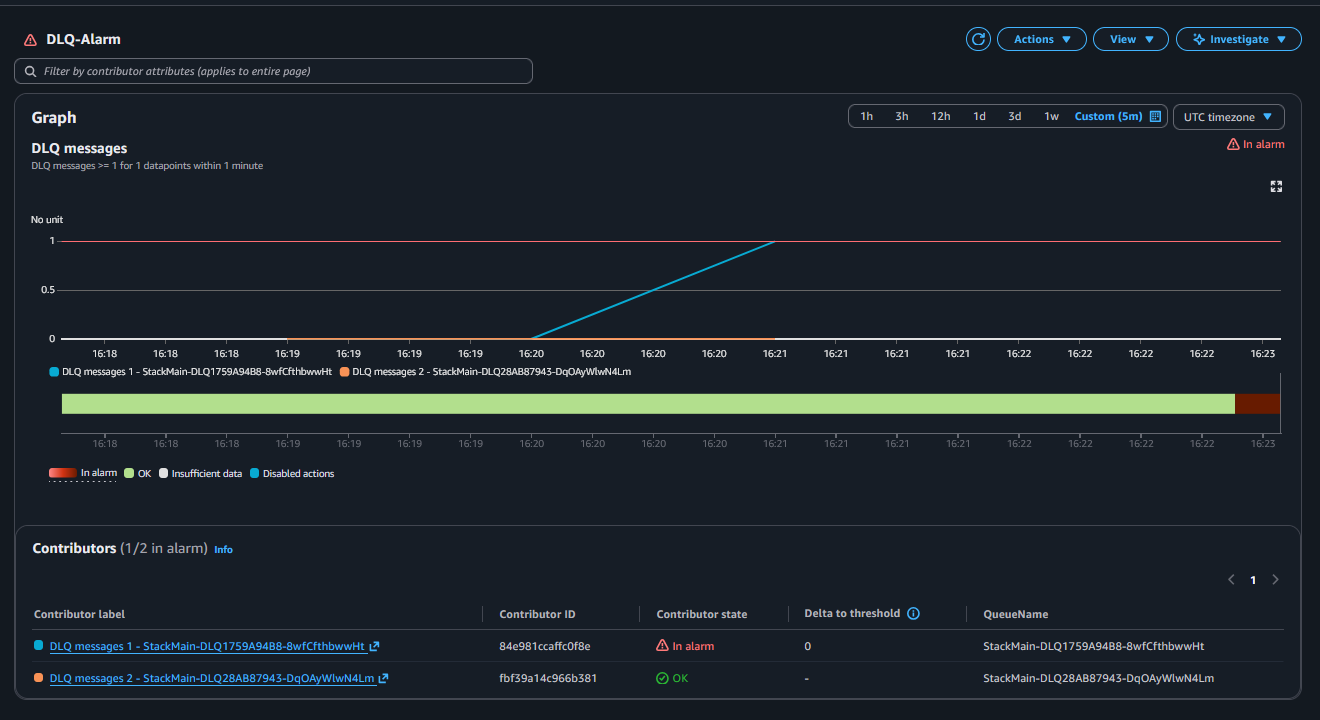
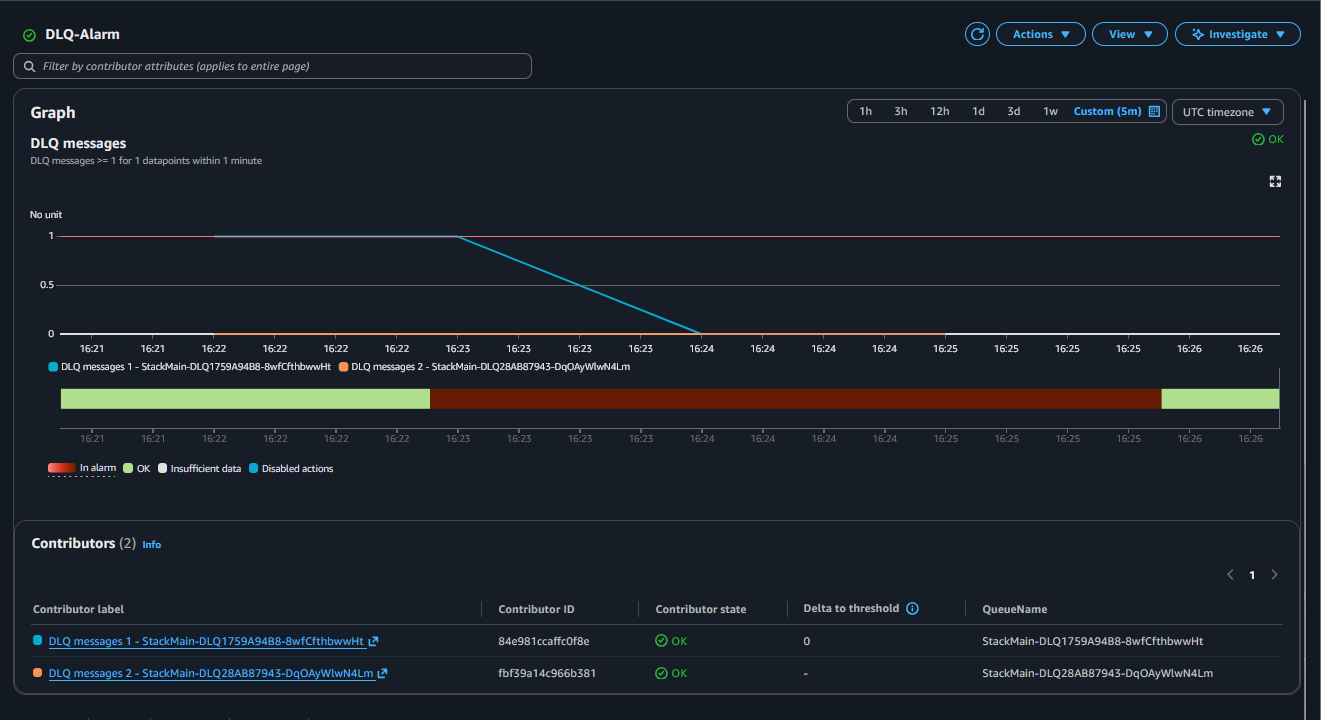
Example 1: one alarm for all DLQs (tag filtered)
Tag only the DLQs you want included (opt-in):
const dlq1 = new Queue(this, "DLQ1");
Tags.of(dlq1).add("isDlq", "true");
Tags.of(dlq1).add("monitor", "true");
new Queue(this, "Queue1", {
  deadLetterQueue: {
    queue: dlq1,
    maxReceiveCount: 3,
  },
});

const dlq2 = new Queue(this, "DLQ2");
Tags.of(dlq2).add("isDlq", "true");
Tags.of(dlq2).add("monitor", "true");
new Queue(this, "Queue2", {
  deadLetterQueue: {
    queue: dlq2,
    maxReceiveCount: 5,
  },
});

const dlq3 = new Queue(this, "DLQ3");
Tags.of(dlq3).add("isDlq", "true");
Tags.of(dlq3).add("monitor", "false");
new Queue(this, "Queue3", {
  deadLetterQueue: {
    queue: dlq3,
    maxReceiveCount: 5,
  },
});const expressionDlq = new MathExpression({
expression: `SELECT MAX(ApproximateNumberOfMessagesVisible)
FROM SCHEMA("AWS/SQS", QueueName)
WHERE tag.monitor = 'true'
AND tag.isDlq = 'true'
GROUP BY QueueName
ORDER BY COUNT() DESC`,
usingMetrics: {},
period: Duration.minutes(1),
label: "DLQ messages",
});
new Alarm(this, "DlqAlarm", {
metric: expressionDlq,
threshold: 1,
evaluationPeriods: 1,
comparisonOperator: ComparisonOperator.GREATER_THAN_OR_EQUAL_TO_THRESHOLD,
alarmDescription: "Alarm if any tagged DLQ has visible messages",
alarmName: "DLQ-Alarm",
});
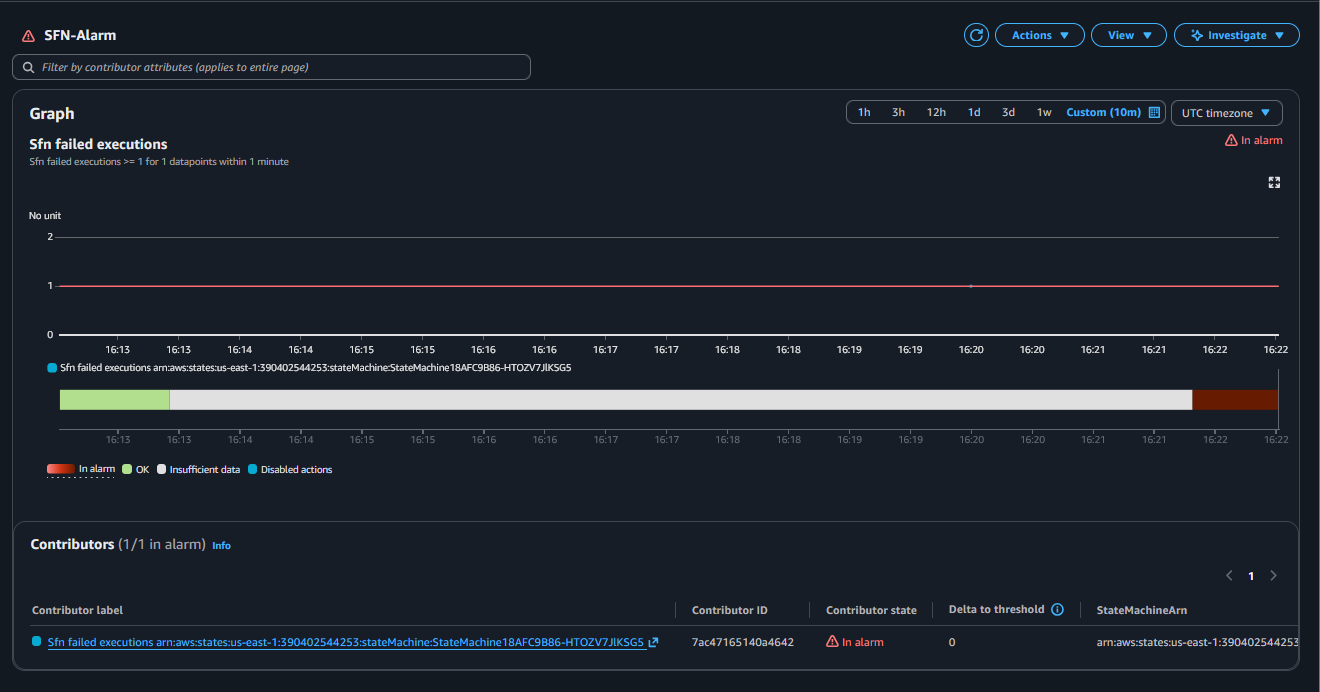
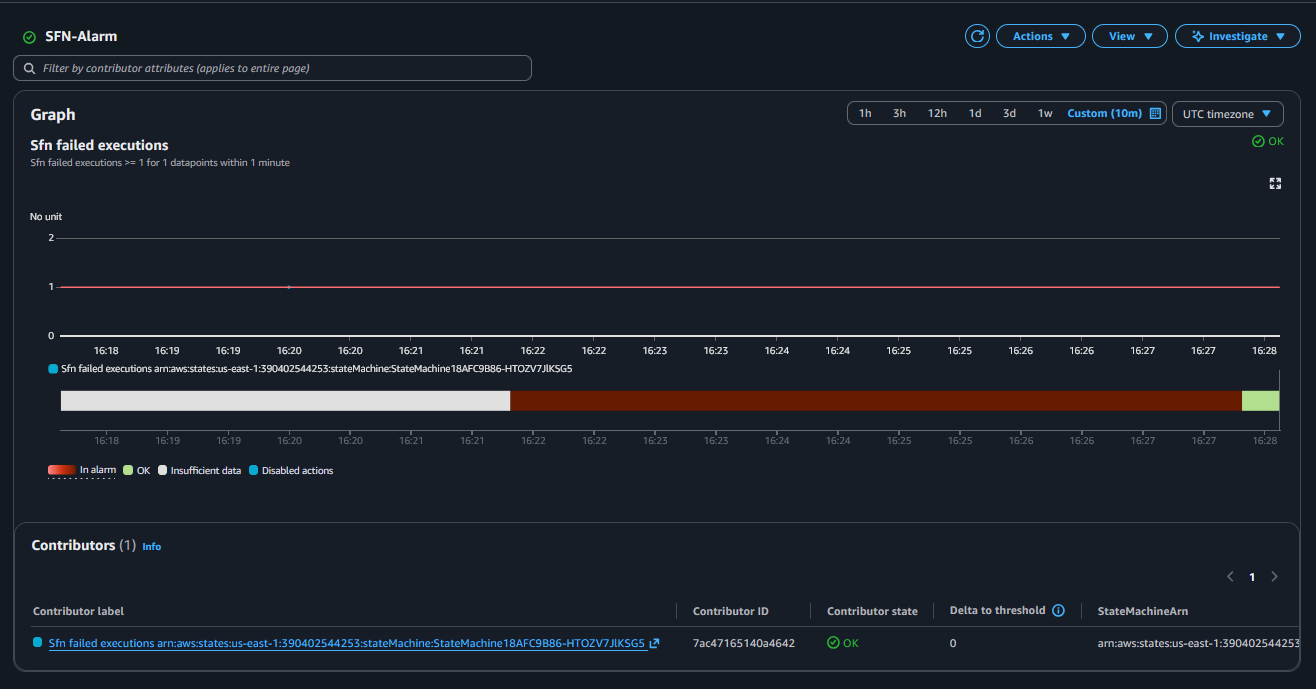
Example 2: one alarm for failed Step Functions executions
Tag filtering only works for resource types supported by resource tags for telemetry (SQS is supported; Step Functions isn’t listed): https://docs.aws.amazon.com/AmazonCloudWatch/latest/monitoring/UsingResourceTagsForTelemetry.html#SupportedAWSInfrastructureMetrics
So for Step Functions, this alarms across all state machines in the account/region.
const sfn1 = new StateMachine(this, "StateMachine1", {
  definitionBody: DefinitionBody.fromChainable(new Fail(this, "FailState1")),
});

const sfn2 = new StateMachine(this, "StateMachine2", {
  definitionBody: DefinitionBody.fromChainable(new Fail(this, "FailState2")),
});const expressionSfn = new MathExpression({
expression: `SELECT MAX(ExecutionsFailed)
FROM SCHEMA("AWS/States", StateMachineName)
GROUP BY StateMachineName
ORDER BY COUNT() DESC`,
usingMetrics: {},
period: Duration.minutes(1),
label: "Sfn failed executions",
});
new Alarm(this, "SfnAlarm", {
metric: expressionSfn,
threshold: 1,
evaluationPeriods: 1,
comparisonOperator: ComparisonOperator.GREATER_THAN_OR_EQUAL_TO_THRESHOLD,
alarmDescription: "Alarm if any state machine has failed executions",
alarmName: "SFN-Alarm",
});
Sources
- Feature announcement: https://aws.amazon.com/about-aws/whats-new/2025/09/amazon-cloudwatch-alarm-multiple-metrics/
- CloudWatch docs (alarms on Metrics Insights queries): https://docs.aws.amazon.com/AmazonCloudWatch/latest/monitoring/cloudwatch-metrics-insights-alarms.html
- CloudWatch docs (create a Metrics Insights alarm): https://docs.aws.amazon.com/AmazonCloudWatch/latest/monitoring/cloudwatch-metrics-insights-alarm-create.html
- CloudWatch docs (enable resource tags on telemetry): https://docs.aws.amazon.com/AmazonCloudWatch/latest/monitoring/EnableResourceTagsOnTelemetry.html
- CloudWatch docs (supported resources for tag enrichment): https://docs.aws.amazon.com/AmazonCloudWatch/latest/monitoring/UsingResourceTagsForTelemetry.html#SupportedAWSInfrastructureMetrics
- CloudWatch docs (Metrics Insights quotas, incl. 500 time series limit): https://docs.aws.amazon.com/AmazonCloudWatch/latest/monitoring/cloudwatch-metrics-insights-limits.html
- Background article: https://pubudu.dev/posts/cloudwatch-multi-metric-alarms/